> ## Documentation Index
> Fetch the complete documentation index at: https://wb-21fd5541-mintlify-c7f6bef2.mintlify.site/llms.txt
> Use this file to discover all available pages before exploring further.
> Color-code W&B runs based on metrics or config parameters to create visually meaningful chart legends.
# Semantic run plot legends
Create visually meaningful line plots and plot legends by color-coding your W\&B runs based on metrics or configuration parameters. Identify patterns and trends across experiments by coloring runs according to their performance metrics (highest, lowest, or latest values). W\&B automatically groups your runs into color-coded buckets based on the values of your selected parameter.
To use metric or configuration-based colors for your runs, you need to configure two settings:
### Turn on key-based colors
Key-based colors are disabled while run grouping is active. Turn off run grouping before you continue.
1. Navigate to your W\&B project.
2. Select the **Workspace** tab from the project sidebar.
3. Click the **Settings** icon in the top right corner.
4. From the drawer, select **Runs**.
5. In the **Run colors** section, select **Key-based colors**.
6. Configure the following options:
* From the **Key** dropdown, select the metric you want to use for assigning colors to runs.
* From the **Y value** dropdown, select the y value you want to use for assigning colors to runs.
* Set the number of buckets to a value from 2 to 8.
When you use key-based colors, the option to [customize run colors](/models/runs/run-colors) isn't available.
The following sections describe how to set the metric and y value and how to customize the buckets used for assigning colors to runs.
### Example: Key-based coloring with loss metric
After you configure the previous settings and close the drawer, line plots in your **Workspace** tab update to use the new colors. In this example plot, **Key** is set to `loss` and **Y value** is set to `Latest`. Runs are colored with a gradient where darker colors represent higher loss values and lighter colors represent lower loss values.
## Set a metric
The metric options in your **Key** dropdown are derived from the key-value pairs [you log to W\&B](/models/runs/color-code-runs/#custom-metrics) and [default metrics](/models/runs/color-code-runs/#default-metrics) defined by W\&B.
### Default metrics
* `Relative Time (Process)`: The relative time of the run, measured in seconds since the start of the run.
* `Relative Time (Wall)`: The relative time of the run, measured in seconds since the start of the run, adjusted for wall clock time.
* `Wall Time`: The wall clock time of the run, measured in seconds since the epoch.
* `Step`: The step number of the run, which is typically used to track the progress of training or evaluation.
### Custom metrics
Color runs and create meaningful plot legends based on custom metrics logged by your training or evaluation scripts. Custom metrics are logged as key-value pairs, where the key is the name of the metric and the value is the metric value.
For example, the following code snippet logs accuracy (`"acc"` key) and loss (`"loss"` key) during a training loop:
```python theme={null}
import wandb
import random
epochs = 10
with wandb.init(project="basic-intro") as run:
# Block simulates a training loop logging metrics
offset = random.random() / 5
for epoch in range(2, epochs):
acc = 1 - 2 ** -epoch - random.random() / epoch - offset
loss = 2 ** -epoch + random.random() / epoch + offset
# Log metrics from your script to W&B
run.log({"acc": acc, "loss": loss})
```
Within the **Key** dropdown, both `"acc"` and `"loss"` are available options.
## Set a configuration key
The configuration options in your **Key** dropdown are derived from the key-value pairs you pass to the `config` parameter when you initialize a W\&B run. Configuration keys are typically used to log hyperparameters or other settings used in your training or evaluation scripts.
```python theme={null}
import wandb
config = {
"learning_rate": 0.01,
"batch_size": 32,
"optimizer": "adam"
}
with wandb.init(project="basic-intro", config=config) as run:
# Your training code here
pass
```
Within the **Key** dropdown, `"learning_rate"`, `"batch_size"`, and `"optimizer"` are available options.
## Set a y value
You can choose from the following options:
* **Latest**: Color based on Y value at last logged step for each line.
* **Max**: Color based on highest Y value logged against the metric.
* **Min**: Color based on lowest Y value logged against the metric.
## Customize buckets
Buckets are ranges of values that W\&B uses to categorize runs based on the metric or configuration key you select. Buckets are evenly distributed across the range of values for the specified metric or configuration key and each bucket is assigned a unique color. Runs that fall within that bucket's range are displayed in that color.
To view or edit buckets, open the workspace settings drawer where you enabled key-based colors:
1. Navigate to your W\&B project and select the **Workspace** tab.
2. Click the **Settings** icon in the top right corner.
3. In the drawer, select **Runs**, then select the **Colors** tab.
4. Set **Run colors** to **Key-based colors**. The **Color palette** setting is hidden and the **Key** dropdown appears.
5. From the **Key** dropdown, select a metric or configuration key. The controls that appear next depend on the type of key you select:
* For a **metric**, use the **Y value** dropdown to choose **Min**, **Max**, or **Latest**, set the **Number of buckets** to a value from 2 to 8, and review the **Buckets** section. Each bucket lists a value range and its color.
* For a **configuration** key, use the **Grouping** dropdown to choose **Continuous** or **Discrete**. **Continuous** groups values into numeric **Buckets**. **Discrete** groups values into **Categories** instead of buckets.
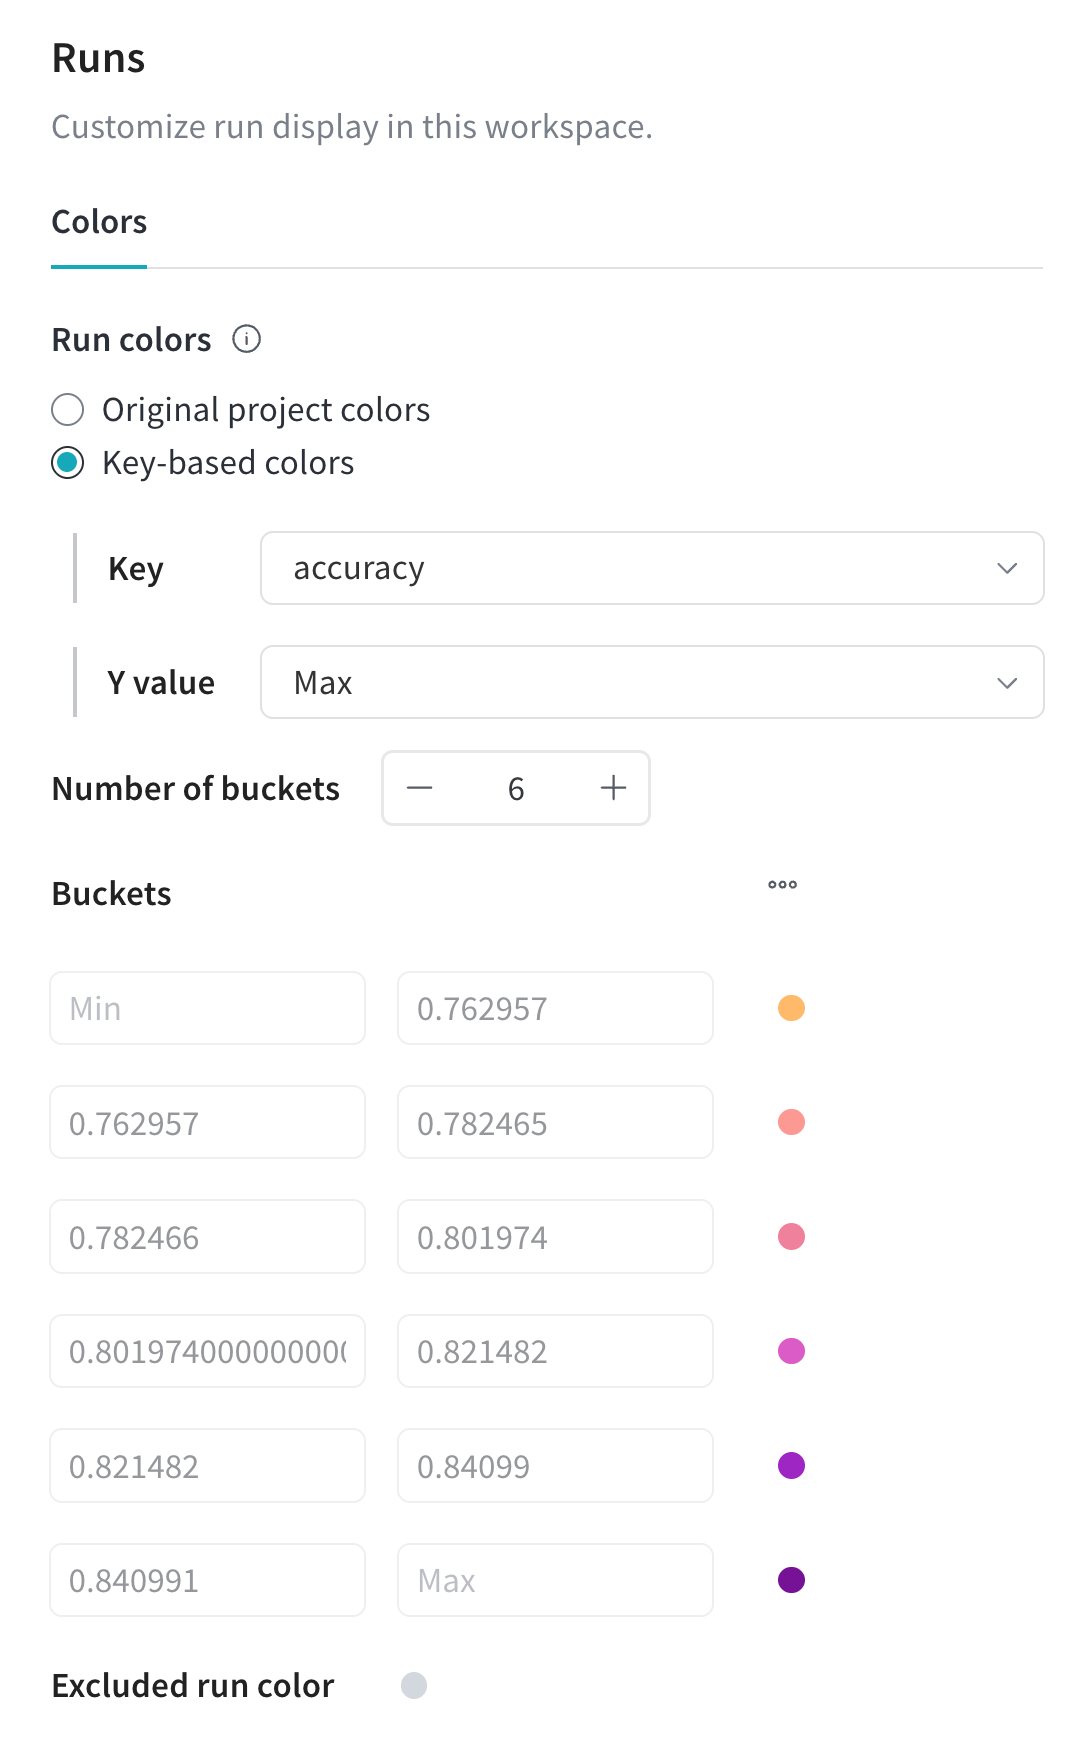
The following screenshot shows the **Runs** settings panel with buckets configured for an accuracy metric:
 In this example:
* **Key** is set to `"Accuracy"` (abbreviated as `"acc"`).
* **Y value** is set to `"Max"`.
With this configuration, W\&B colors each run based on their accuracy values. The colors vary from a light yellow color to a deep color. Lighter colors represent lower accuracy values, while deeper colors represent higher accuracy values.
Six buckets are defined for the metric, with each bucket representing a range of accuracy values. Within the **Buckets** section, the following range of buckets are defined:
* Bucket 1: (Min - 0.7629)
* Bucket 2: (0.7629 - 0.7824)
* Bucket 3: (0.7824 - 0.8019)
* Bucket 4: (0.8019 - 0.8214)
* Bucket 5: (0.8214 - 0.8409)
* Bucket 6: (0.8409 - Max)
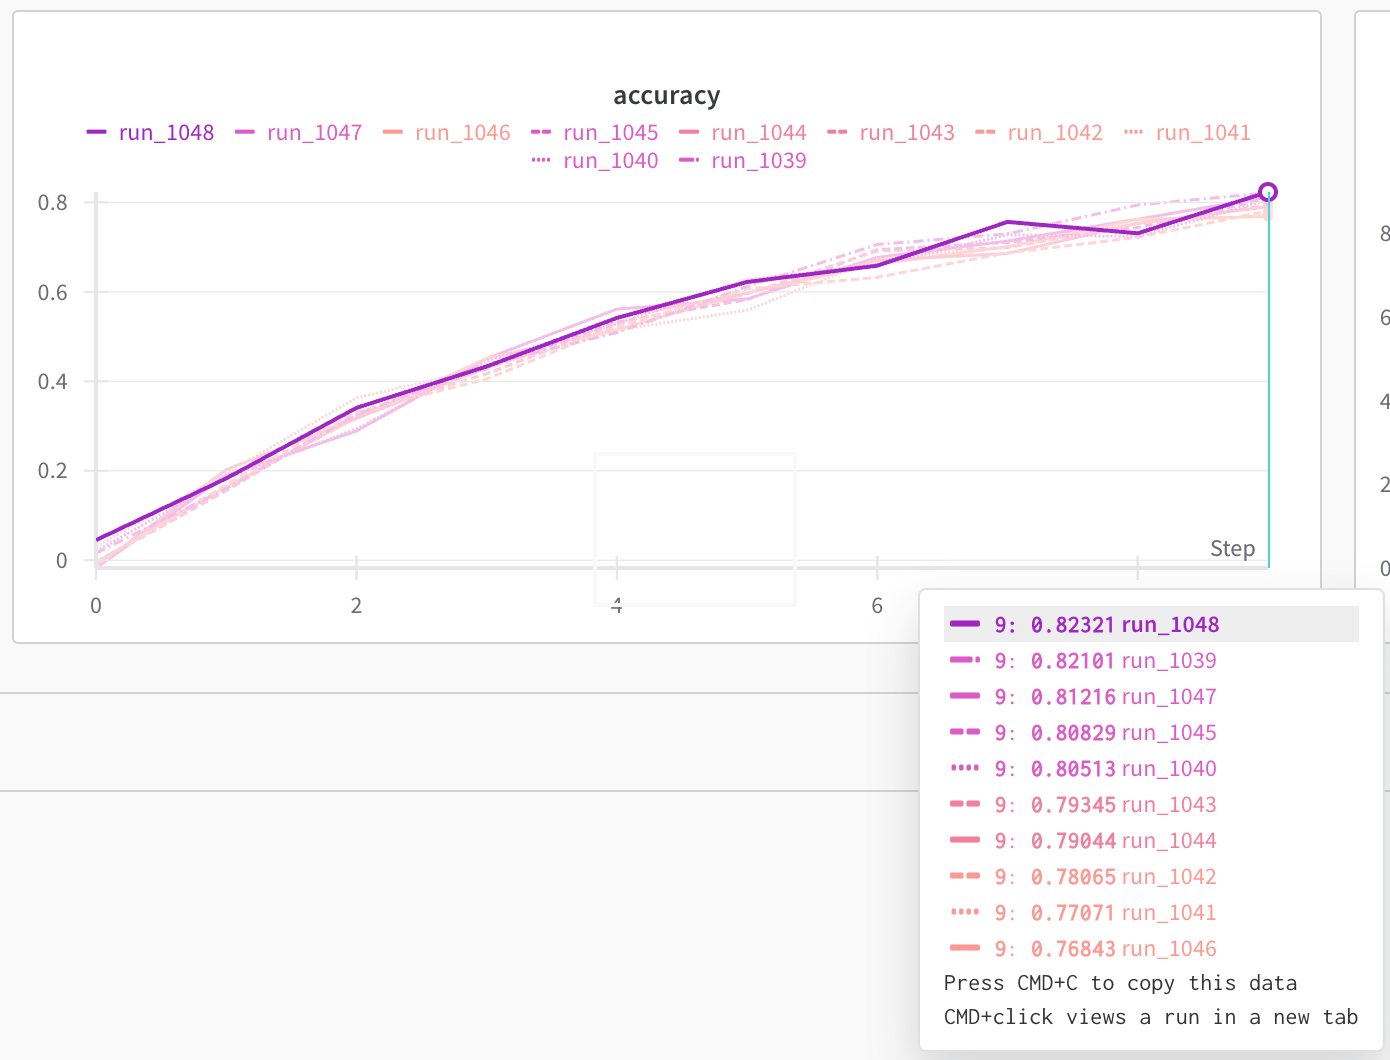
After you close the settings drawer, line plots in the workspace update to use the bucket colors. In the following line plot, the run with the highest accuracy (0.8232) is colored in a deep purple (Bucket 5), while the run with the lowest accuracy (0.7684) is colored in a light orange (Bucket 2). The other runs are colored based on their accuracy values, with the color gradient indicating their relative performance.
In this example:
* **Key** is set to `"Accuracy"` (abbreviated as `"acc"`).
* **Y value** is set to `"Max"`.
With this configuration, W\&B colors each run based on their accuracy values. The colors vary from a light yellow color to a deep color. Lighter colors represent lower accuracy values, while deeper colors represent higher accuracy values.
Six buckets are defined for the metric, with each bucket representing a range of accuracy values. Within the **Buckets** section, the following range of buckets are defined:
* Bucket 1: (Min - 0.7629)
* Bucket 2: (0.7629 - 0.7824)
* Bucket 3: (0.7824 - 0.8019)
* Bucket 4: (0.8019 - 0.8214)
* Bucket 5: (0.8214 - 0.8409)
* Bucket 6: (0.8409 - Max)
After you close the settings drawer, line plots in the workspace update to use the bucket colors. In the following line plot, the run with the highest accuracy (0.8232) is colored in a deep purple (Bucket 5), while the run with the lowest accuracy (0.7684) is colored in a light orange (Bucket 2). The other runs are colored based on their accuracy values, with the color gradient indicating their relative performance.